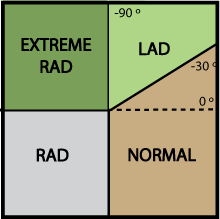
| LAD | -90° ↔ -30° |
| Normal | -30° ↔ +90° |
| RAD | 90° ↔ 180° |
| Extreme RAD | 180° ↔ -90° |
Determining the Axis
The electrical axis of an EKG describes the overall direction of depolarization of the ventricles. In a normal heart, depolarization proceeds from the sinus node, through the AV node, down the bundle of his to the purkinje fibres. The purkinje fibres run along the inner, endocardial surface of the ventricles and depolarization proceeds outwards through the myocardium towards the epicardium. In a normal heart, the axis is between -30 and 90 degrees. This is because the thickest part of myocardium that contributes most to the shape of the QRS complex lies in the left ventricle.
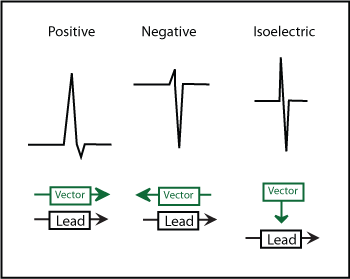
Each lead can "see" the depolarization vector. If its moving away from it, it will be negative, and if it moving towards it, it will be positive. A vector moving at 90° to the lead will be isoelectric. (see right)
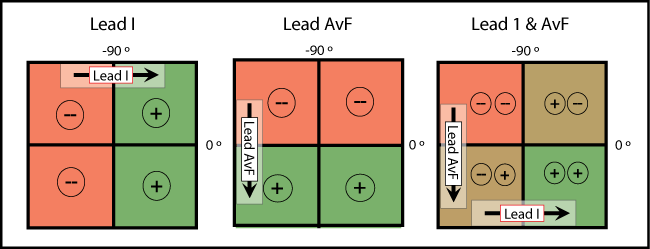
So, looking at the limb leads (see below): for lead I, any vector between -90° and +90° will be positive. For aVF, any vector inferiorly between 0° and 180° will be positive. A lead positive in I and aVF must have a vector between 0° and 90° . By looking at which leads are more positive or negative, you can place any EKG into one of four quadrants in the figure at the top of the page. Although in the example, we use aVF for simplicity, it`s preferable to use lead II as it takes into account vectors to -30° that are still considered normal.
A simplified approach to axis is to look at leads I and II.
| Axis | Lead I | Lead II |
| Normal | + | + |
| LAD | + | - |
| RAD | - | + |
| Ext. RAD | - | - |
So, using this tool, an EKG which has a positive QRS in I and a negative QRS in II has LAD.
The axis is a crucial part of every EKG interpretation and can be an indicator of serious underlying pathology like ventricular hypertrophy, or conduction blocks.