PHGY 212 Blood Lab
Erythrocyte Fragility Test
Erythrocyte Fragility Test
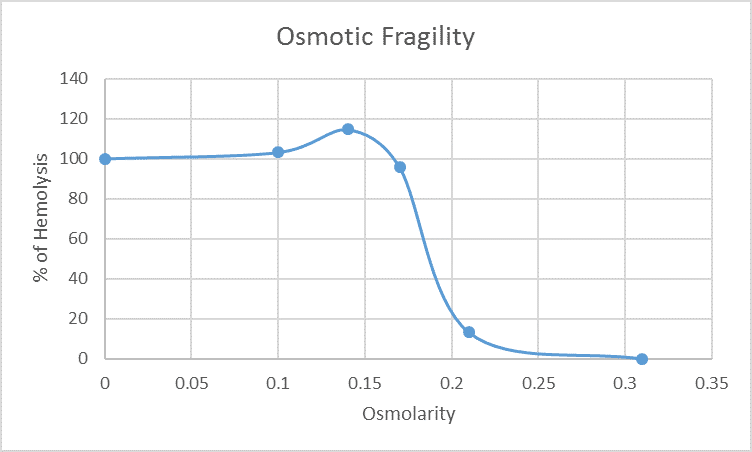
In this experiment, we make use of the osmotic fragility (or susceptibility to hemolysis) of erythrocytes and that, the number of cells undergoing hemolysis depends on the degree of hypotonicity of the extracellular medium. The concentration of liberated hemoglobin in each test medium is an index of the extent of osmotic hemolysis. Your task is to examine the relationship between percentage of hemolysis and osmolarity of the medium in which the erythrocytes were suspended.
The osmotic fragility test is designed to give some information on the capacity of the red cell membrane to withstand increasing internal pressures brought about by the diffusion of water into the cell.
Mandatory revision of pipetting techniques
Procedure
Erythrocyte Fragility Test(procedure video) |
|
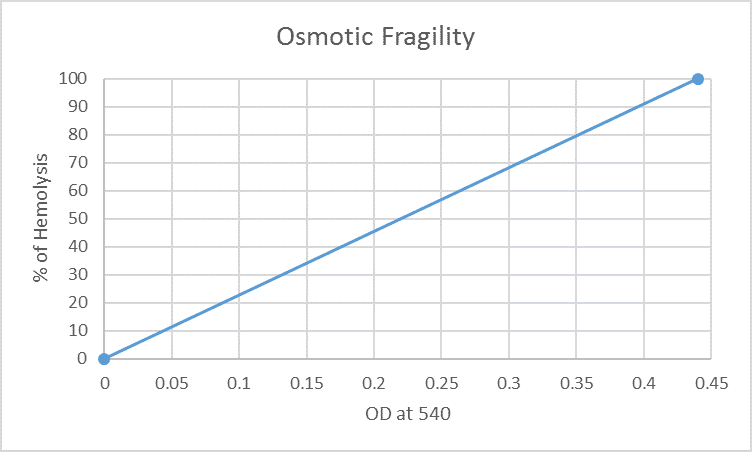
Results |
|
Example: from the calibration curve above, a tube with an OD reading of 0.35, will have a % of hemolysis of 80% |
|
Questions to think about:
| |