|
RMP
Laboratory |
RMP >
Analysis |
| |
Sample data collected for a
given solution might appear as follows: 5 deflections of approximately
equal amplitude. The membrane potential for each penetration is
calculated by subtracting the
Tip Potential
from the Tip +
Membrane Potential. |
|
|
| |
From the determined membrane
potentials, the mean membrane potential will be calculated. There will
be some variation in each solution data set, and this will be reflected
in the standard deviation. |
|

|
|
Step-like data similar to
the above will be obtained for all 9 solutions (6 solutions without TEA,
3 with TEA). Of course, for solutions with higher extracellular
concentrations of [K+]o, the step-size will be smaller, and
correspondingly, the membrane potential will be smaller (less negative). |
Normal Ringer's
(No TEA) |
|
|
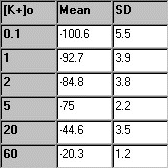
From each of the first six
solutions (no TEA), the five membrane potential readings are averaged,
and the mean and standard deviation are determined. In the table to the
right, some sample experimental data are presented. |

|
|
A t-test is performed to
determine whether there is a significant difference between the mean
values of Em for the two extreme solutions, that is [K+]o = 0.1 and 60
mM. |
|
Results of the t-test |
| In the
example above, the calculated t = 31.9. Since there are 5
observations per group, the degrees of freedom = 8. At a level of 5%
confidence,
checking the t-table,
we read a value of 2.31. Since 31.9>2.31, we conclude that the
difference between the two means is statistically significant (i.e.
that is does not occur due to chance). We conclude that Em does
depend on [K+]o. |
|
|
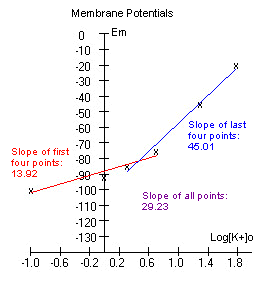
The data is plotted and a line is fitted
through the first four, and the last four points.
If the experiment was
performed correctly, the graph might look somewhat like the one to the
right below. |
|
The slope of the first four
points is less than that of the last four points. This is because at
lower [K+]o, Na+ ions contribute more to the membrane potential.
(Remember that although the membrane is permeable mostly to K+, it is
slightly permeable to Na+). At low extracellular concentrations of K+,
the [Na+] ions have more of a tendency to move into the cell due to a
high driving force
acting on the Na ions, thus making the membrane potential less negative.
As a result, the slope is more gentle. At high [K+]o however, the Na+
ions play less of a role (the driving force pushing Na into the cell is
not as great), thus Em is close to Ek, and the slope of the line
approaches 58. We would expect a slope of 58 if Em=Ek. |

|
|
Note:
The driving force
for a particular ion (Na+) is a measure of how far those ions are from
their equilibrium potential (ENa).
Assuming ENa
is somewhere around +60 mV, you should be able to visualize looking at
the graph above, how much greater the driving force will be at low
rather than high [K+]o. The driving force is a form of potential energy;
such as the potential energy which is stored in a heavy object moved to
a high place, and which can be easily released. |
|
With TEA |
|
|
From each of the three
solutions with TEA, the five membrane potential readings are averaged,
and the mean and standard deviation are determined. In the table to the
right, some sample experimental data is presented. |

|
|
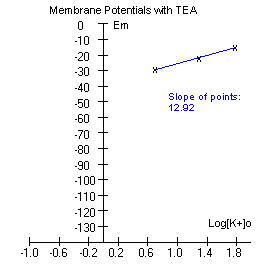
The data is plotted and a line is fitted
through the points.
If the experiment was performed correctly, the graph might look somewhat
like the one to the right below. |
|
The slope of the points is
considerably less than what we obtained without TEA above. TEA is a
compound that blocks potassium channels. If potassium permeability has
been reduced, we expect the membrane potential to move more towards
sodium's equilibrium potential (Ena), and this is exactly what has
happened. To review how relative permeability to Na+ and K+ contributes
to the membrane potential,
click here. |
 |
|
Click
here to return to the Virtual lab home page |