|
Clinician's corner |
|
Back to main page |
|
Programmer's corner |
| So, you use WinBUGS a lot? Want more? |
|
Patrick Blisle Division of Clinical Epidemiology McGill University Health Center Montreal, Quebec CANADA patrick.belisle@rimuhc.ca Last modification: 14 jun 2017
|
|
|
Version 1.10 (November 2014)
forest.plot.or
[R] Drawing a forest plot
| [ | forest.plot.or is an R function developped to produce a forest plot. | ] |
Menu
Top
Syntax
forest.plot.or(m0 = NULL,
n0 = NULL,
m1 = NULL,
n1 = NULL,
authors,
log.scale = standard.or.plot,
group.labels = c('Group 0', 'Group 1'),
meta.ci = rep(NA,3),
study.categories = numeric(0),
category.labels = character(0),
categories.ci = matrix(NA,length(category.labels),3),
studies.ci = matrix(NA,length(authors),3),
plot.categories.ci = rep(T,length(category.labels)),
categories.indent = T,
plot.lim = matrix(c(0,10,.2,5),ncol=2,byrow=T)[1+log.scale,],
xlim = c(0,100),
ylim = c(0,diff(xlim)*par()$fin[2]/par()$fin[1]),
authors.spaces = 20,
nN.spaces = 20,
OR.plot.spaces = 20,
OR.num.spaces = 20,
ci.spaces = c(5,5),
J = 0.5,
test = F,
na.rm = F,
na.string = "n/a",
tick.lim = T,
ref.vline.at = 1,
add.ticks.at = ref.vline.at,
tick.pch = 17,
dots.prop2n = F,
f.radius = 0.5,
cex = 1-0.3*length(grep("^win\\.metafile\\:", names(dev.cur()))),
circles.cex = cex,
or.side.labels = character(0),
or.side.labels.cex = cex,
blank.after.category.label = F,
blank.between.categories = T,
blank.before.category.subtotal = F,
blank.after.total = plot.xaxis,
meta.ci.pch = 15,
category.subtotal.pch = meta.ci.pch,
ci.txt = "Odds Ratio (95% CrI)",
study.txt = "Trial",
ratios.gr1.over.gr0 = T,
or.ncharacters = 4,
or.min.ndecimals = 0,
standard.or.plot = T,
show.nN.indiv = standard.or.plot,
show.nN.tot = F,
print.or.ci = T,
report.meta.ci = standard.or.plot,
sort.by.desc.samplesize = F,
placebo.index = seq(along=m1),
plot.xaxis = F,
reverse.printed.columns.order = F,
nN.txt = "n/N" )
Top
forest.plot.or arguments
Table below presents the complete list of forest.plot.or arguments along with their signification and, for some of them, a link to an illustrative example.
In most applications, only the arguments in the upper part of the table need be defined, while default values for the remaining will do.
| Argument | Value | Comment |
| m0 | Number of events in unexposed (or control, or placebo) group. | |
| m1 | Number of events in exposed (or treatment) group. | |
| n0 | Total number of subjects in unexposed (or control, or placebo) group. | |
| n1 | Total number of subjects in exposed (or treatment) group. | |
| authors | Publications short reference label (typically, authors and year of publication). ◊ Character vector of same length as m0 and n0. |
|
| group.labels | Group labels. | See example below, where group.labels = c('Thrombectomy', 'No Thrombectomy'). |
| meta.ci |
Credible interval as calculated (outside of this program) from the meta analysis of all papers included in the forest plot.
◊ Vector of length 3, where first component is the median and the next two the lower and upper credible interval limits, respectively. |
IMPORTANT forest.plot.or WILL NOT run a meta-analysis to get an overall credible interval for the Odds Ratio. A meta-analysis must be run beforehand, e.g. through the use of WinBUGS or other software. See for example the Blocker WinBUGS example. |
| In most applications, default values for each option below will do. However, they can add considerable flexibility to the plot if necessary. |
||
| log.scale | Whether or not forest plot should be drawn on the log scale. ◊ Logical. Default is T when standard.or.plot is T. |
|
| study.categories | When studies are divided into different categories, category index for each study. ◊ Numeric vector of same length as authors. |
See example below where papers are divided in Observational studies and Randomized controlled trials. |
| category.labels | When studies are divided into different categories, labels for each category presented. Must be used along with study.categories. |
See example below. |
| categories.ci | When studies are divided into different categories and meta-analysis results for each category (taken separately) are to be presented in the forest plot, enter credible intervals for each category through categories.ci. ◊ Matrix of m rows and 3 columns, where m is equal to the length of category.labels. | |
| studies.ci | Credible intervals for the Odds Ratio for each study. ◊ A matrix of m rows x 3 columns, where m is equal to the length of m0, n0 or authors. Default is empty, in which case forest.plot.or will estimate it by a sampling method, sketched in comments (right). → |
If studies.ci is not provided by user, it is computed for each study i by sampling 100,000 values for outcome probability
pik, k=0,1,
with pik ~ Beta(mk[i] + J, nk[i] - mk[i] + J),
and taking the 2.5%, 50% and 97.5% quantiles of the odds ratio values obtained from the calculation pi1/(1-pi1) / pi0/(1-pi0).
Computed values will be returned in the output and will therefore be reusable, shall you like to reproduce the plot with exactly the same confidence intervals later on (by using it as input to studies.ci). See below for a description for J. |
| plot.categories.ci | A vector indicating whether or not each corresponding row of categories.ci is to be plotted in the forest plot. ◊ Logical vector of same length as category.labels. | |
| categories.indent | Whether or not authors list should be indented, relatively to categories labels. | Irrelevant unless category.labels and study.categories are defined. See illustration below. |
| plot.lim | Lower and upper limits of the plotted area. ◊ Vector of length 2. |
|
| xlim | Lower and upper limits of the x-axis of the produced figure (as a whole, that is, taking into account surrounding text). ◊ Vector of length 2. |
|
| ylim | Lower and upper limits of the y-axis of the produced figure. ◊ Vector of length 2. |
|
| authors.spaces nN.spaces OR.plot.spaces OR.num.spaces ci.spaces |
Horizontal space allowed to each part of the forest plot. Each of these arguments are single numeric values, except for ci.spaces, which is a numeric vector of length 2. |
Horizontal spacing between the two n/N columns serves as the unit of reference. See illustration below for details. |
| J | Weight added to each cell count in the computation of individual studies' odds ratio median and credible interval estimates, to prevent against division by zero's.
◊ Default is 0.5. |
Irrelevant if studies.ci is fully provided. |
| test |
Whether function is called as a test to see what the plot would look like (it terms of spacing, character expansion, etc.),
without actually computing values for studies.ci (if it was left empty in function call), which may take some time. ◊ Logical. Default is F |
|
| na.rm | Whether or not studies with a missing value in any of m0, n0, m1 or n1 should be dropped from forest plot. ◊ Logical. Default is F. |
|
| na.string | Text to display when some of the m/n values are missing. ◊ Default is "n/a". |
tick.lim | Whether or not ticks should be plotted at the lower and upper limits of the plot region. ◊ Logical. Default is T. |
| ref.vline.at | At which x-value to draw a reference vertical line. ◊ Numeric. Default reference vertical line location at 1. |
To draw a forest plot without a reference vertical line, call with ref.vline.at = numeric(0). |
| add.ticks.at | Where to add ticks on the x-axis. ◊ Numeric. Default is to add a tick under the vertical line, at ref.vline.at. |
|
| tick.pch | Plotting character to use in x-axis ticks. ◊ Default is 17, the code for a solid triangle. |
Type show.pch() to see the complete list of available plotting characters. |
| dots.prop2n | Whether or not dots sizes (around point estimates) should be proportional to total sample size (n0+n1) of corresponding study. ◊ Logical. Default is F. |
|
| f.radius | Size of larger dot (around point estimates), in fraction of vertical spacing allowed to each study. | Irrelevant when dots.prop2n is F. |
| cex | A numerical value giving the amount by which plotting text should be magnified relative to the default. ◊ Default is 0.7 in Windows Metafiles (.wmf), 1 in other figure formats. |
|
| circles.cex | A numerical value giving the amount by which plotting symbols (i.e., the circles around studies OR point estimates) should be magnified relative to the default. ◊ Default is equal to cex. |
|
| or.side.labels | Text to be displayed on each side of the plot region. ◊ Character vector of length 2. |
See illustration below. |
| or.side.labels.cex | A numerical value giving the amount by which the side OR side labels (see or.side.labels above) should be magnified relative to the default. | Irrelevant when or.side.labels is not specified. |
| blank.after.category.label blank.between.categories blank.before.category.subtotal blank.after.total |
Whether or not each line/section described should be preceded or followed by a blank line. ◊ Logical. Default are F, T, F and plot.xaxis, in order. |
Irrelevant unless category.labels is specified. |
| meta.ci.pch | Plotting character drawn at OR's point estimate (read or obtained from meta.ci). ◊ Numeric. Default is 15, the code for a dark square. |
Type show.pch() in R to see the complete list of available plotting characters. |
| category.subtotal.pch | Plotting character drawn at OR's point estimate in each category (read from categories.ci). | Irrelevant unless categories.ci is specified and plot.categories.ci is T for at least one studies category. |
| ci.txt | Text to be displayed on top of both credible interval numeric description and graphical representation. ◊ Character value. Default is Odds Ratio (95% CrI). |
|
| study.txt | Text to be displayed on top of authors list. ◊ Default is "Trial". |
|
| ratios.gr1.over.gr0 | Whether or not ORs should be calculated in terms og group 1 vs group 0 (T), or the inverse (F). ◊ Logical. Default is T. |
|
| or.ncharacters | Length of ORs to be displayed (in number of characters). | Zeros will be added to the right of numbers that are shorter than specified value. For example, 1.2 will display as 1.20 if or.ncharacters=4. |
| or.min.ndecimals | Minimum number of decimal places to display (even though the length of displayed number thus exceeds or.ncharacters). | |
| standard.or.plot | Whether or not forest.plot.or is used to draw a forest plot for a meta-analysis on odds ratios. ◊ Logical. Default is T. |
See illustration below for an example with standard.or.plot = F, in which case n/N columns are not displayed. forest.plot.or can thus be used for general meta-analyses reports and/or graphical comparisons of results obtained in different studies. |
| show.nN.indiv show.nN.tot |
Whether or not you want the fractions m0/n0 and m1/n1
for individual studies and in total to be displayed or not. ◊ Logical. Default is T for show.nN.indiv if standard.or.plot is T, F for show.nN.tot. |
See illustration below. | print.or.ci | Whether or not the numeric values for OR point estimates and credible interval endpoints should be reported. ◊ Logical. Default is T. |
| report.meta.ci | Whether or not the Total line at the bottom of the forest plot, including the total numbers n/N, the graphical representation of the posterior credible interval for OR and the OR numeric point estimate and credible interval endpoints should be reported. ◊ Logical. Default is T if standard.or.plot is T. |
|
| sort.by.desc.samplesize | Whether or not study entries should be listed in descending order of total sample size (n0+n1). ◊ Logical. Default is F. |
|
| placebo.index | A (numeric) vector of indices, of same length as m1 and n1,
indicating to which component of group 0 numbers (m0 and n0)
each component of m1 and n1 do correspond. ◊ Default is a componentwise correspondance. |
Sometimes, studies consider the effect of a treatment in different arms, thus reporting different numbers for each study arm
plus numbers for ONE placebo group. If you repeat the placebo group numbers in m0 and n0 as many times as there are study arms,
they will be accounted for in placebo group total numbers as many times as they are repeated, which is obviously wrong.
The work-around is thus to have each placebo group to appear only once in vectors m0 and n0
and each study arm appear once as well in m1 and n1, leading to the latter two being of different lengths from the former two.
The placebo.index, of same length as m1 and n1, will then be used to match (m1, n1) elements to those in (m0, n0).
For example, suppose you have 5 studies, of which study 2 has involved 3 study arms and study 5 has involved 2, while the other three studies have involved only one arm: in this case, m0 and n0 will be of length 5, and placebo.index = c(1, 2, 2, 2, 3, 4, 5, 5). |
| plot.xaxis | Whether or not an x-axis should be plotted at the bottom of plot region. ◊ Logical. Default is F. |
See illustration below. |
| reverse.printed.columns.order | Whether or not the order in which group results are printed should be reversed. ◊ Logical. Default is F, that is, group 0 results are printed in the left column, followed by group 1 results in the right column. | Irrelevant when standard.or.plot is F. |
| nN.txt |
Text to be displayed below group labels. ◊ Character. Default is "n/N" |
Call with nN.txt=character(0) if you'd rather not have any text displayed below group labels. |
| Top |
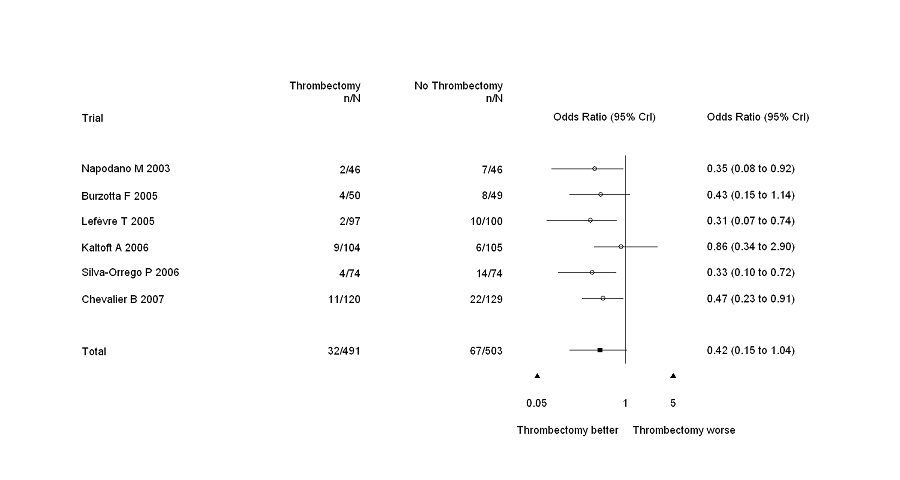
Output example
Typically, forest plots drawn with forest.plot.or will look like the forest plot illustrated below.
| Top |
A few arguments illustrated
Horizontal spacing
category.labels and study.categories
|

categories.indent
|
|
or.side.labels
|
|
plot.xaxis
|
|
show.nN.tot
|
|
standard.or.plot = F
|
Top
Sample code
Shall you want to give a quick try to forest.plot.or, you might want to use the code below.
source('your-path/forest-plot.R')
group.labels <- c('Thrombectomy', 'No Thrombectomy')
side.labels <- c('Thrombectomy worse', 'Thrombectomy better')
studies.ci <- c( 1.1663, 0.4136, 4.2673, 1.0398, 0.4235, 2.5669, 1.1868, 0.3871, 5.7488, 1.0496, 0.3552, 3.2706, 1.0351, 0.4493, 2.4721,
1.0252, 0.4676, 2.3361, 1.9648, 0.8545, 5.9002, 1.0448, 0.3556, 3.1771, 1.0250, 0.2536, 4.1454, 0.93792, 0.3260, 2.3974,
1.1643, 0.4098, 4.3059, 1.1414, 0.5254, 2.8010, 0.93734, 0.2671, 2.7538, 0.60781, 0.3176, 1.0824)
studies.ci <- matrix(studies.ci, ncol=3, byrow=T)
authors <- c("Beran G 2002", "Napodano M 2003", "Antoniucci D 2004", "Kunii H 2004", "Burzotta F 2005", "Lefèvre T 2005",
"Ali A 2006", "Kaltoft A 2006", "Silva-Orrego P 2006", "Dudek D 2007", "Sardella G 2007", "Chevalier B 2008",
"Ikari Y 2008", "Svilaas T 2008")
meta.ci <- c(1.0690, 0.6298, 1.9214)
data <- structure(list(N = 14,
m.placebo = c(1, 5, 0, 2, 6, 7, 4, 2,0, 1, 4, 6, 31, 2),
n.placebo = c(33, 46, 50, 129, 48, 101, 240,107, 74, 87, 94, 129, 531, 171),
m.treatment = c(2, 5, 1, 2,6, 7, 15, 2, 0, 2, 3, 7, 15, 1),
n.treatment = c(33, 46, 50,129, 48, 100, 240, 108, 74, 88, 102, 120, 529, 178)),
.Names = c("N", "m.placebo", "n.placebo", "m.treatment", "n.treatment"))
forest.plot.or(m0=data$m.treatment, n0=data$n.treatment, m1=data$m.placebo, n1=data$n.placebo, authors=authors, or.side.labels=rev(side.labels), plot.lim=c(.1, 5),
group.labels=group.labels, studies.ci=studies.ci, meta.ci=meta.ci, show.nN.tot=T)
title('Death, myocardial infarction or stroke\nAll Thrombectomy Devices')
Top
Download
forest.plot.or is a free R function. Download version 1.10 now.