|
Respiration
Laboratory |
Pneumotachometry>
Experiments |
| |
- in the first exercise, air flow and
tidal volume signals are recorded during normal respiration and the
vital capacity manoeuvre.
- in the second exercise, the Forced
Vital Capacity manoeuvre is recorded. The rate of the expired air
flow will depend on the elastic recoil properties of the lung and
the resistance to air flow as well as on the voluntary expiratory
effort.
- the third exercise will show the
expiratory flow vs. volume changes with increased expiratory
resistance.
- CO2 and O2
concentrations will be recorded during different breathing patterns.
|
|
Lung volume and capacities |
The following values are measured:
- duration of the respiratory cycle
- inspiratory time and expiratory time
- peak inspiratory and expiratory
flows
- tidal volume
|
The following values are calculated:
- rate of breathing or frequency
- minute ventilation
|
|
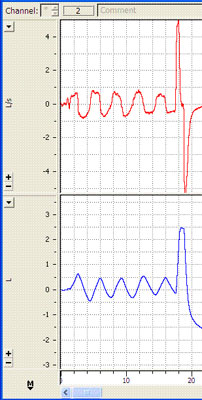 |
The red trace on top shows
flow on Channel 1.
Where are peak inspiratory and peak expiratory flows on this trace? |
The blue trace (Channel 2) shows
corresponding volumes with normal respiration followed by maximal
inspiration and maximal expiration.
Refer to the Theory section to review concepts. |
|
Forced Vital Capacity
manoeuvre |
|
The Forced
Vital Capacity (FVC) manoeuvre is based on the Vital Capacity manoeuvre
with an added element of speed; an individual exhales with a maximal
force and speed. The rate of the expired air flow will depend on the
elastic recoil properties of the lung and the resistance to airflow as
well as on the voluntary expiratory effort. A healthy individual is able
to expel at least 80% of his/her vital capacity during the first second
of forced expiration. |
|
The start of the forced
expiration is obtained by linear extrapolation of the steepest part of
the volume-time diagram. |
|
FVC is the volume change of
the lung between a full inspiration to total lung capacity and a maximal
expiration to residual volume. The measurement is performed during
forceful expiration; the preceding maximal inspiration does not need to
be done forcefully . The manoeuvre is performed together with the
assessment of the FEV1 and of
maximum expiratory flow-volume curves. |
|
Questions to think about:
-How would FEV1 change with airflow
limitations: airway obstruction, bronchoconstriction or
bronchodilatation?
-What does FEV1 expressed as a
percentage of the FVC show?
-How does FEV1as a percentage of VC
change with age in the adult? |
|
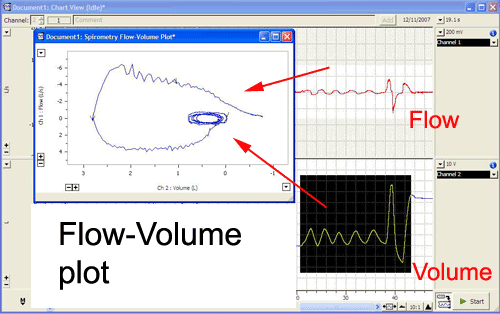
Flow-volume curve |
|
It is
the graph produced by plotting the instantaneous flow of respiratory gas
against the simultaneous lung volume. The principal advantage of the
flow-volume curve is that it can show whether flows are appropriate for
a particular lung volume. |
|
 |
|
 |
|
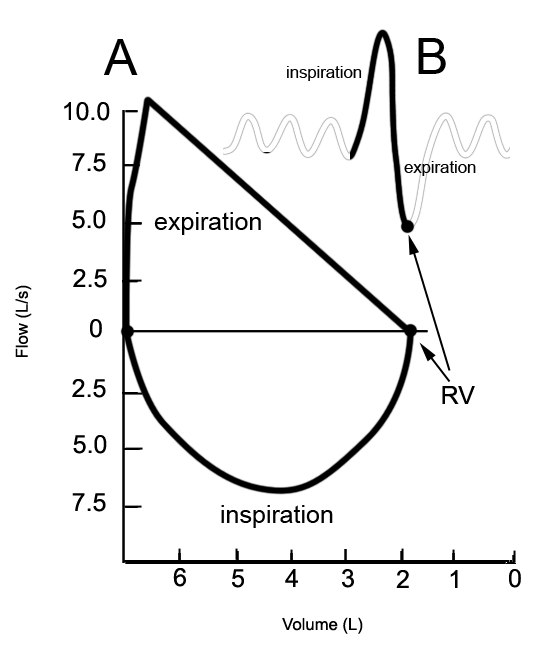
Study the shape of the
expiratory flow trace (top part of diagram A above): after a rapid
rise, there is a slow decline unlike the round inspiratory flow. Why?
As you forcefully expire, the small airways are closing (pressure
outside the small airways is greater than inside the small airways),
therefore there is a further restriction to air flow (slow decline of
last part of expiratory flow).
During inspiration, the airways are patent (unobstructed) because
intrathoracic pressure opens the airways.
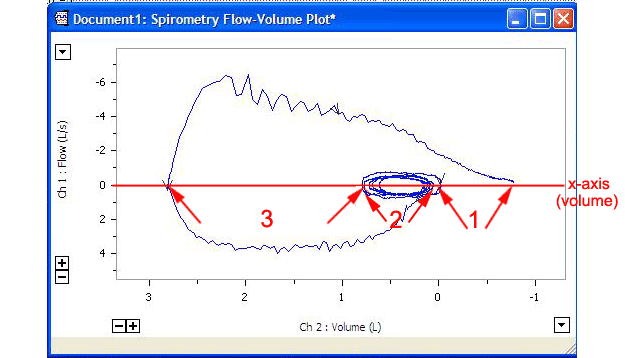
Can you identify the volume
quantities (1, 2 and 3) on the flow-volume curve below constructed while
the tidal volume and maximal inspiration/expiration were recorded?
 |
|
Flow-volume plot changes
with different airway conditions |
|
Questions
to think about:
- How would the Flow-Volume curve
change with restrictive lung disease, obstructive lung disease, and
fixed major airway obstruction? |
|
 |
|
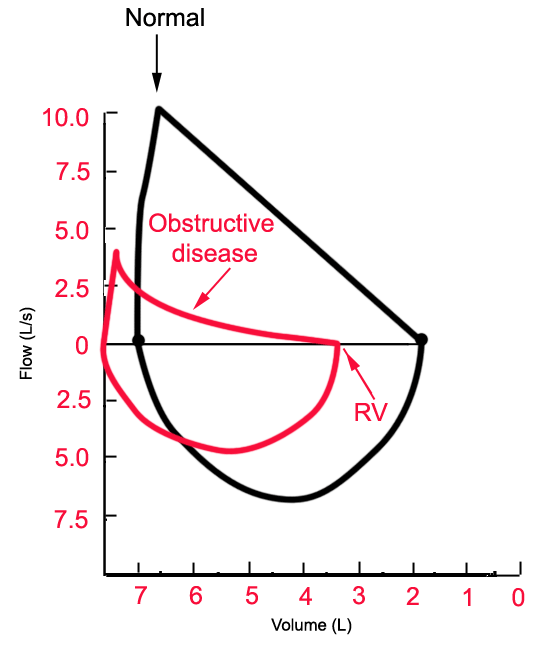
Obstructive disease:
Although all flow rates are diminished, expiratory prolongation
predominates. What are examples of obstructive lung disease? |
 |
|
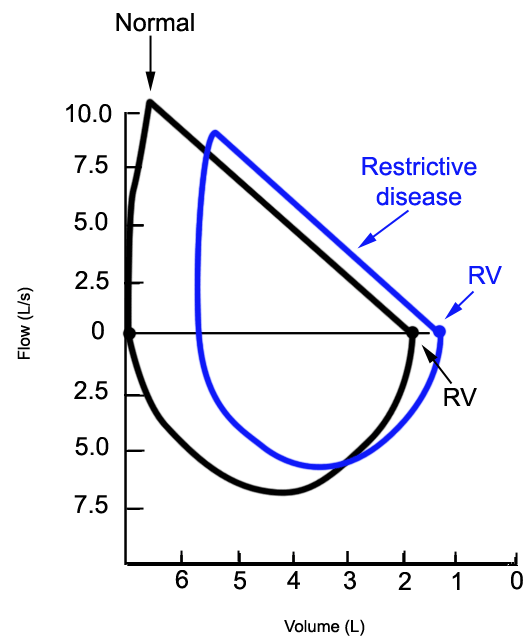
Restrictive disease:
the flow-volume curve is narrowed because of diminished lung volumes,
but the shape is generally the same as in normal volume. Flow rates are
greater than normal at comparable lung volumes because the elastic
recoil of lungs holds the airways open. What are examples of restrictive
lung disease? |
 |
|
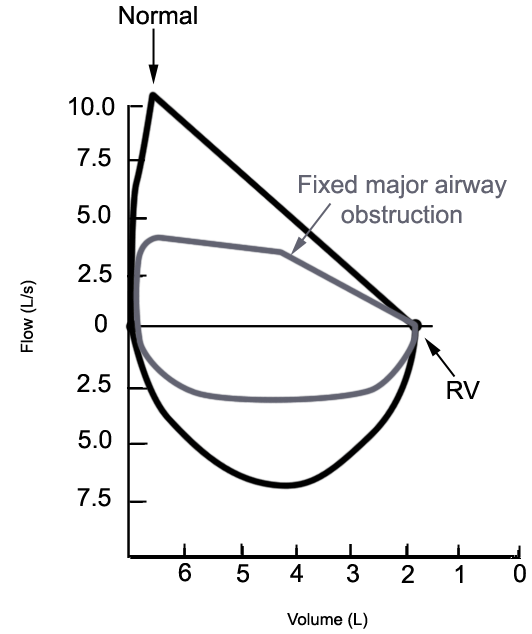
Fixed obstruction:
the flow is equally limited during expiration and inspiration. |
|
Breathing patterns and O2/CO2
analysis |
|
Technical detail of the
apparatus used to measure O2/CO2 : it operates
with an infra-red transducer to measure CO2 concentration and
a visible spectrum transducer to measure O2 concentration. It
also consists of a variable pump which draws sample gas through the two
transducers. The pump can be set to any flow rate in the range 35 ml/min
to 200 ml/min. The analyzer has a response time of about 0.2 s
(at ~200 ml/min). |
|
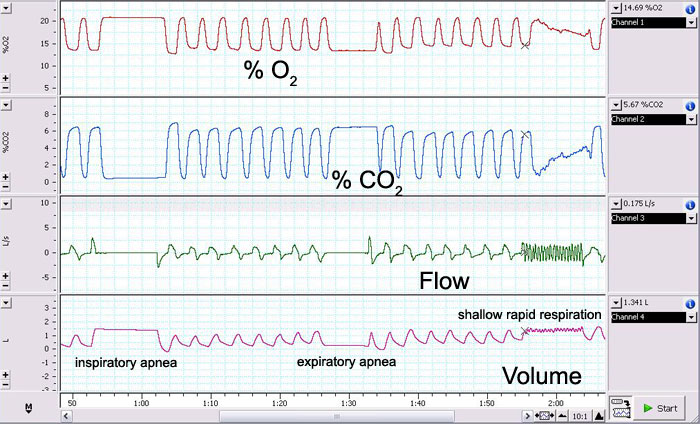
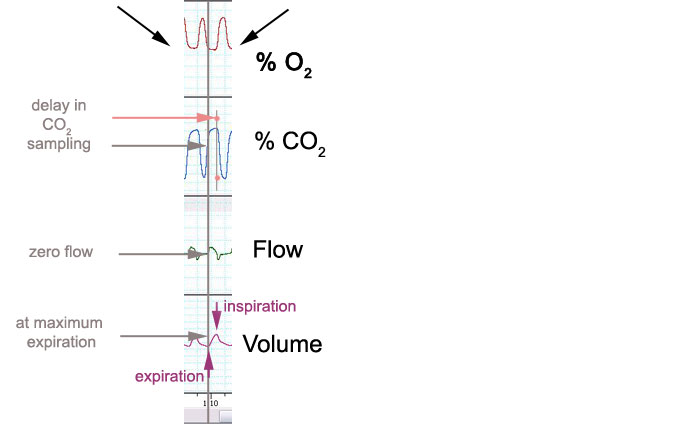
The detail above shows the delay between
respiratory phases and the rate of gas sampling: at the end of maximal
expiration, a maximal CO2 content would be recorded.
Notice and explain differences in the gas
concentrations in relation to the following breathing patterns:
-
during normal breathing
-
during a shallow and rapid
respiration
-
following the VC
manoeuvre
-
during and following
inspiratory apnea
|