|
Biomedical Signals Acquisition |
Sine Wave Acquisition |
| |
In this experiment, an electrical sine wave generated by a
function generator is sampled and displayed, in order to demonstrate some key issues in
data acquisition and A/D conversion. For a full understanding of this section, it is highly
recommended that you first review the basics of Analogue to Digital Conversion. |
|
|
Go to A/D Conversion Page Now |
|
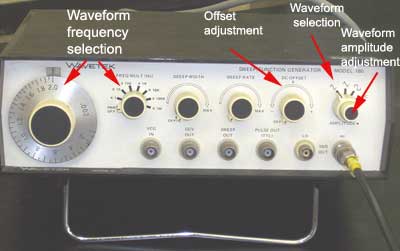
For this part of
the laboratory session you will be collecting data generated
from a function generator which may look like the model above. |
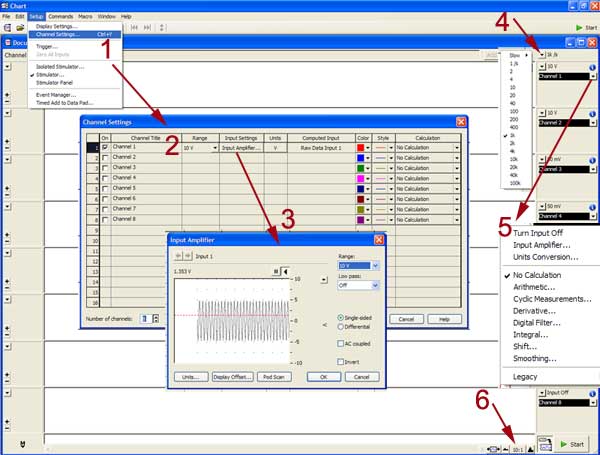
Any
data acquisition software must permit you to set the following
parameters:
- channel settings: you may need to
acquire data coming from more than 1 channel, in case there are more
than one device connected to the recording system.
- You then need to specify the number
of channels and disregard the rest of the available channels.
- for each channel: you need to
specify the sampling range and whether you have a differential
recording arrangement or not.
- you can specify the acquisition rate
or sampling frequency: how often you need to collect points from
your waveform, in order to reconstruct your waveform without
artifact.
- you can also specify whether you
want to apply digital filtering, amplification (gain) etc...
- you can also control the time axis,
displaying your waveform.
|
|
|
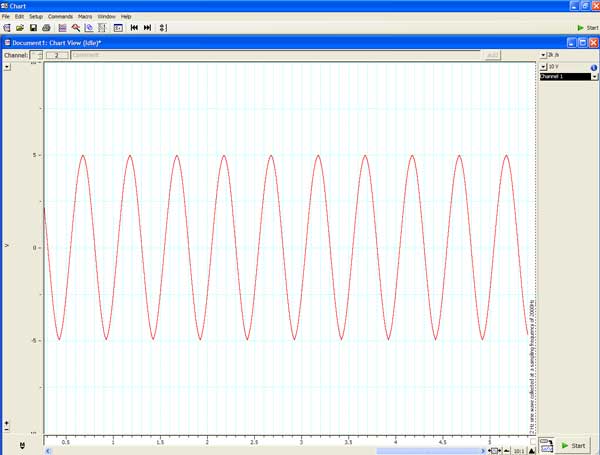
| The recorded
sine wave would appear as shown below. Note the maximum and minimum
amplitude of the wave. The following pages will explore how changes in
the display and acquisition parameters will affect the sampled signal. |
|
 |
|
|
|
To continue with the
topic Gain Settings, click here |