|
Signals are functions of one or more
independent variables and typically contain information about the
behaviour or nature of some phenomenon. Systems usually respond to
particular signals by producing other signals. The representation of a
signal as a plot of amplitude versus time constitutes the waveform.
The pattern of variations contained in the waveforms gives us
information about the signal; for example, the human vocal mechanism
produces speech by creating fluctuations in acoustic pressure.
Deterministic signals: a signal is
deterministic if it is exactly predictable for the time span of
interest. Deterministic signals can be described by mathematical models.
A sinusoidal signal is described by :
V(t)= A* sin(w
* t),
where V(t) is the signal over time
A (=amplitude) and w
are the model parameters (2pf=w).
f is the frequency of the sine wave.
l
is the period of the sine wave and is the inverse of the frequency (1/f)
So: V(t) = A sin(2pft)
Stochastic or random signals: a
signal whose value has some element of chance associated with it,
therefore it cannot be predicted exactly. Consequently, statistical
properties and probabilities must be used to describe stochastic
signals. In practice, biological signals often have both deterministic
and stochastic components.
Signal amplitude statistics
A number of statistics may be used as a measure of the location or
"centre" of a random signal:
- the mean
is the average amplitude of the signal over time
- the median
is the value at which half of the observations in the sample have
values smaller than the median and half have values larger than the
median. The median is often used as the measure of the "centre" of a
signal because it is less sensitive to outliers.
- the mode
is the most frequently occurring value of the signal
- maximal and minimal amplitude are
the maximal and minimal value of the signal during a given time
interval
- range: the
range or peak-to-peak amplitude is the difference between
the minimum and maximum values of a signal.
Continuous time signals versus
discrete time signals
The signals are continuous time signals when the independent variable is
continuous, therefore the signals are defined for a continuum of values
of the independent variable X(t). An analogue
signal is a continuous time signal. Discrete time signals are only
defined at discrete times; the independent variable takes on only a
discrete set of values X(n). A digital
signal is a discrete time signal.
A discrete time signal may represent a phenomenon for which the
independent variable is inherently discrete (e.g., amount of calories
per day on a diet). On the other hand, a discrete signal may represent
successive samples of an underlying phenomenon for which the independent
variable is continuous (e.g., a visual image captured by a digital
camera is made of individual pixels that can assume different colours).
Measuring signal frequency using
spectral analysis
There are quantitative methods to measure the frequency and amplitude of
a waveform. One of the most well known is called spectral analysis: any
waveform can be mathematically decomposed in a sum of different
waveforms. This is what the so-called Fourier analysis does; it
decomposes the waveform in different components and measure the
amplitude (power) of each frequency component. What is plotted is a
graph of power (amplitude) vs. frequency.
|
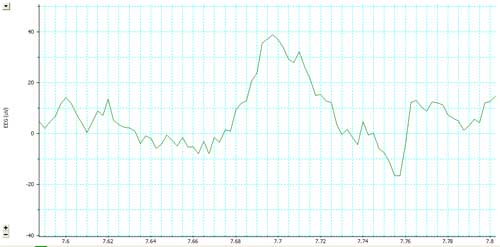
The trace above
shows a segment of an EEG recording: this waveform can be
decomposed in a sum of different waveforms, as shown by the
image below. |
|
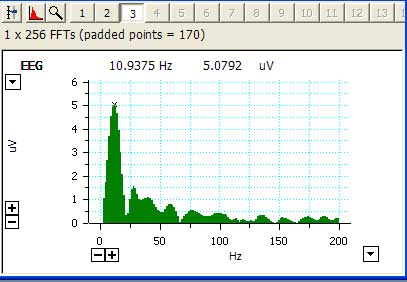
The spectral
analysis and plot of an EEG recording |
|
|
|