|
Biomedical Signals Acquisition |
EEG > alpha waves |
| |
The on-going electrical
activity of the brain (EEG) measured from electrodes placed on the scalp
is an example of a stochastic signal which may give some information
about the general mental state of the individual. |
| |
|
|
Alpha waves are 7.5 Hz to 13
Hz relatively large amplitude(usually less than 50
microV, although
this can be variable from subject to subject) EEG waves associated with a relaxed but
awaken state. Is usually best seen in the posterior regions of the head
on each side, being higher in amplitude on the dominant side.
Beta waves are 14 Hz to 20 Hz waves of lower amplitude
than alpha waves associated with a more active mental state. |
| Recording the EEG: Subject preparation and
equipment setup |
|
|
Copyright
ADInstruments. All rights reserved. |
|
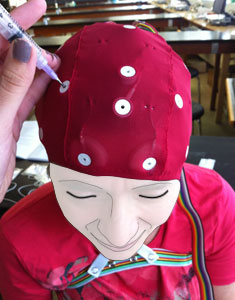
The subject wears the electro-cap:
·
The subject holds
his or her arms straight in front of them. The body harness is slipped
under the armpits and around the chest with the Velcro strips to the
subject’s right side. The elastic is pulled taut and the Velcro
strips are pressed together.The snaps are centered on the chest. The fit
should be snug.
·
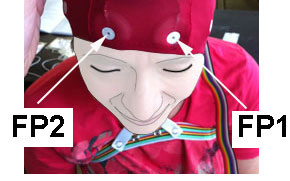
One disposable sponge disk is placed around each of the Fp1 and Fp2
electrode mounts, with the paper side away from the cap material. The
sponge disks absorb perspiration and prevent the spread of electrode gel
onto the forehead and help positioning the electro-cap.
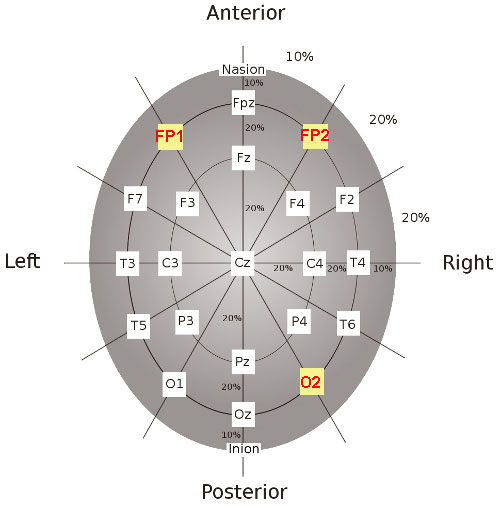
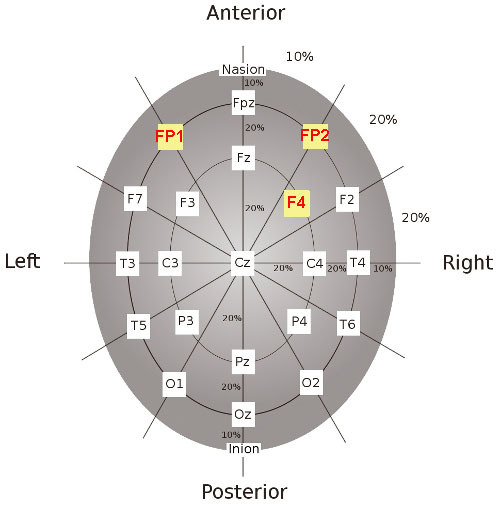
The circumference of the head is measured with the paper ruler from
nasion to inion. 10% of this measurement (from nasion to the forehead)
will coincide with the placement of the Fp1 and Fp2 electrodes of the
electro-cap on the subject. The paper is removed from the foam disks.
With the fingers on the inside of the electro-cap and the thumbs on
the outside
·
Fp1
and Fp2
are anchored on the forehead. The electro-cap is placed
onto the head by working the hands from the front to the back of
the cap in a smooth motion.
·
The
electro-cap is attached to the body harness by holding and pulling both
straps down to the body harness simultaneously. The right strap is
crossed to the left side and snapped to the body harness. The left strap
is crossed to the right side and is snapped to the body harness.
·
The buckles tighten the straps: the electro-cap must be stretched over
the head and under constant tension, otherwise numerous artifacts will
result.
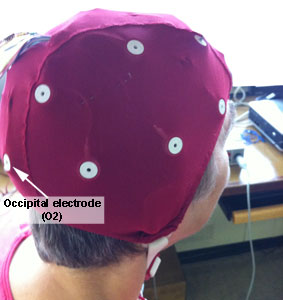
Fill the electrodes: Fp1 and Fp2 and O2 (Occipital)
by injecting the electrolyte gel with the syringe - with a moderate
amount of downward pressure - into the holes of the electrodes. |
|
 |
 |
|
Example of recordings |
|
Recording from the Occipital electrode arrangement |
|
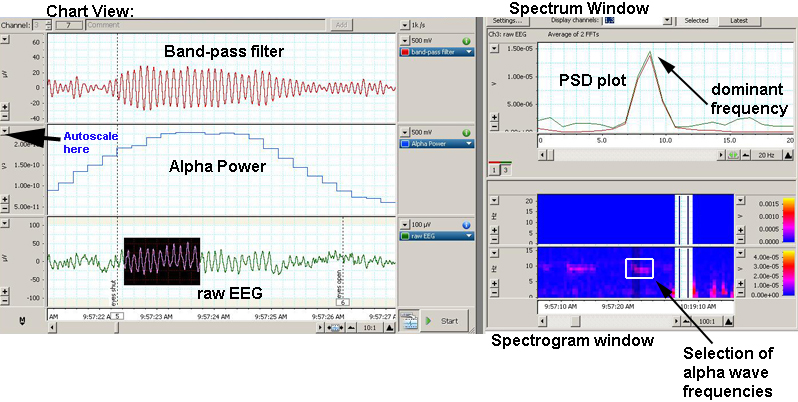
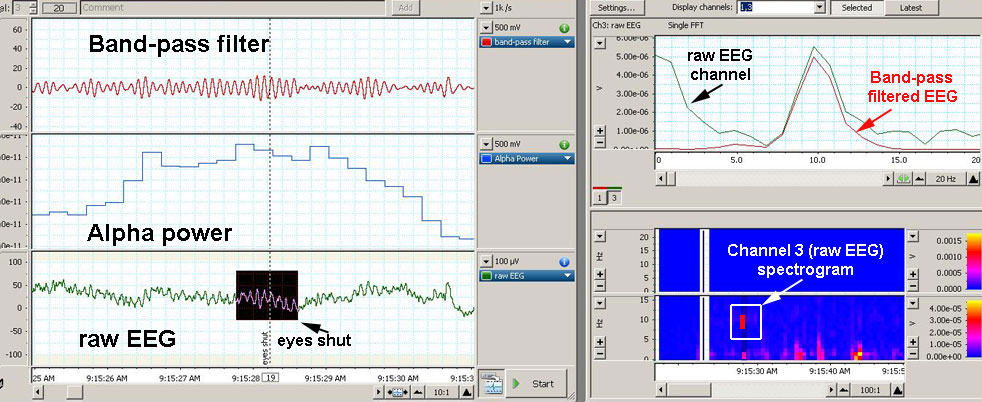
Software: |
- Channel 1 is labeled "band-pass filter"; it
applies a digital filter to the raw EEG signal coming from channel 3
in order to only let the alpha frequencies through.
|
- Channel 2 is labeled "alpha power" and
calculates the accumulated power of the spectrum within the alpha
waves frequencies present in the raw EEG from channel 3.
|
- Channel 3 is labeled "raw EEG" receives the output from the cap
electrodes.
|
To the right of the Chart View, the spectrum window (top) shows a PSD
plot of channels 1 and 3 and the spectrogram window (bottom) shows a
false-colour plot (i.e. 3-dimensional plot) of spectral power, frequency
and time. The spectrogram displays spectral power as a coded
colour (pink) against time and frequency.
One can find specific
frequencies by scrolling through the spectrogram and find "pink" bands
location against the frequency (Hz) on the y-axis. |
 |
|
In the recording above, the raw EEG channel displays alpha waves (the
subject has shut his eyes and is quite relaxed); the corresponding FFT
calculation (spectrum window) shows a dominant frequency at about 9 Hz.
The "alpha power channel" shows an increase in accumulated power
corresponding to the presence of the alpha waves. The band-pass filter
shows a higher amplitude of incoming signals corresponding to the
highlighted data on channel 3 (raw EEG). |
|
|
 |
|
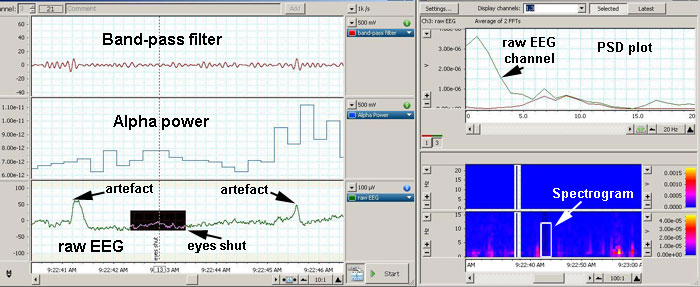
In the recording above, fewer alpha waves are evidenced. The alpha power
shows an increased accumulated power corresponding to the segment of
data which is highlighted. The PSD plot to the top right shows a
dominant frequency of about 10 Hz, however the FFT calculation of the
raw EEG channel also shows other frequencies (notice the lower
frequencies: 1Hz-4 Hz) as opposed to the FFT calculations of Channel1
(band-pass filter). The coloured spectrogram shows a pink area at
about 10hz and at lower frequencies. |
Recording from the Frontal electrode arrangement
|
|
|
Copyright
ADInstruments. All rights reserved. |
 Gel
is added to the F4 electrode. Gel
is added to the F4 electrode. |
|
The recording below shows a reduction in wave amplitude (raw EEG), a
decreased accumulated power (Alpha power), a Band-pass filter channel
which shows very small amplitude signal, a PSD plot which shows mostly
frequencies below 4 Hz and a spectrogram with barely visible if not
present spectral power of the selected data. This recording was made
while the subject had his eyes closed, relaxed. The electrode
arrangement was F4 (frontal). What is your conclusion? What are
the differences between this recording and the one with the occipital
electrode arrangement? |
 |
| |
|
|
| |
|
|
|
|
|
|
| |
|
|
| |
|
|
| |
|
|
| |
| |
| |
| |