|
Cardiovascular Laboratory |
ECG> Basics |
| |
In brief, you need to understand and
remember:
- the depolarization and repolarization
sequence in the heart
- the fact that when
a wavefront of depolarization travels towards the + electrode
and away from the electrode attached to the - terminal, a
positive-going deflection will result.
- the voltage recorded along a
particular lead axis at a particular time is obtained by
taking a projection onto that axis of the vector representing the
magnitude and direction of depolarization at that time.
- Einthoven's law: a
complex in lead II is equal to the sum of the corresponding complexes
in leads I and III.
|
| |
|
|
Activation
of the Heart and the ECG |
|
| The drawings to the right in the table below show the main
stages of activation of the heart, as well as the ECG recorded in lead II at those
stages. |
|
|
The electrical activity of the heart originates in the
sino-atrial node. The impulse then rapidly spreads through the right atrium to the
atrioventricular node. It also spreads through the atrial muscle directly from the
right atrium to the left atrium. The P-wave is generated by
activation of the muscle of both atria. |
|
|
The impulse travels very slowly through the AV node,
then very quickly through the bundle of His, then the bundle branches, the
Purkinje network, and finally the ventricular muscle. |
|
The first area of the ventricular muscle to
be activated is the interventricular septum, which activates from left to right. This generates the
Q-wave. |
|
|
Next, the left and right ventricular free
walls, which form the bulk of the muscle of both ventricles, gets
activated, with the endocardial surface being activated before the epicardial surface.
This generates the R-wave. |
|
|
A few small areas of the ventricles are activated at a
rather late stage. This generates the S-wave. |
|
|
Finally, the ventricular muscle repolarizes. This generates
the T-wave. |
|
To understand the morphology of the ECG waveforms one needs
to appreciate only one biophysical fact: if a wavefront of depolarization travels towards
the electrode attached to the + input terminal of the ECG amplifier and away from the
electrode attached to the - terminal, a positive-going deflection will result. If
the waveform travels away from the + electrode towards the -
electrode, a negative
going deflection will be seen.
If the waveform is travelling in a direction
perpendicular to the line joining the sites where the two electrodes are placed, no deflection
or a biphasic deflection will be produced. |
 |
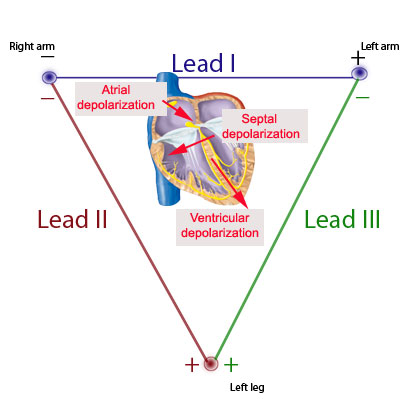
| One can thus see that the voltage
recorded along a particular lead axis (the vector joining the - to the + electrode) at a
particular time is obtained by taking a projection onto that axis of the vector
representing the magnitude and direction of depolarization at that time. Thus, when
the lead axis in the figure above points from left to right, parallel to the direction of
movement of depolarization, a positive-going complex results. When the
two directions are anti-parallel, a negative-going complex is produced. |
|
| From the principles outlined above,
one can determine how the ECG waveforms arise at each point in time. For example,
since the direction of atrial depolarization is almost exactly parallel to the axis of
lead II (which is from RA to LL), a positive-going deflection (P wave) would result in
that lead. |
Since the ventricular muscle is much thicker in
the left than in the right ventricle, the summated depolarization of the two ventricles is
downwards and toward the left leg: this produces again a positive-going deflection
(R-wave) in lead II, since the depolarization vector is in the same direction as the lead
II axis.
As septal depolarization moves from left to right, the depolarization vector is
directed towards the - electrode of lead II (RA), and therefore a negative-going
deflection (Q-wave) is produced. |
 |
|
|
Cardiac axis |
|
The cardiac axis refers to the mean direction
of the wave of ventricular depolarization in the frontal plane, measured
from a zero reference point. The mean QRS axis is obtained from
measurements of the heights of the QRS waves in the 3 leads.
|
|
In the
example to the right, notice that there are tall R waves in leads I and II, and that in lead
III, the R and the S waves are of equal size and opposite direction.
Let
us now calculate the direction of depolarization of the ventricular
muscle. We have to arrive at a vector such that the projections of this
vector onto the three lead axes is consistent with the height of the QRS
complexes in the three leads.
|
 |
 |
 |
COMMON MISCONCEPTIONS ABOUT THE ECG
- The PR interval is
NOT in general measured from the P
wave to the R wave. It is rather defined to be the time from the
beginning of the P-wave to the beginning of the QRS complex. Thus the
PR interval is measured from the beginning of the P-wave to the
beginning of the R-wave only if the first deflection in the QRS
complex happens to be an R-wave (i.e. no Q-wave present).
- Similarly, the QT interval is
NOT in general measured from the
Q-wave to the T-wave. It is rather defined as the time from the
beginning of the QRS complex to the end of the T-wave.
- The P-wave (QRS complex) is
NOT generated by the contraction of
the atria (ventricles). It is generated by electrical activity (more
specifically depolarization or activation) of the muscle.
- Purkinje fibre cells are NOT nerve
cells. Rather, they are specialized cardiac muscle cells. The
sinoatrial node, atrioventricular node, bundle of His, and bundle
branches are also made up of specialized cardiac muscle cells.
The following statements are
true:
- One does NOT
see any deflection on the ECG during the time that the sinoatrial node
is being depolarized. The depolarization of the atrioventricular node
and the His-Purkinje system also does not generate any electrical
activity that is detectable in the ECG.
- One does not
necessarily see a Q-wave or an R-wave or an S-wave in
each lead that one examines. Indeed, in some individuals with
perfectly normal hearts, there is no Q-wave present in any of the
three leads I-III. Other normal individuals have no S-waves in any of
the three leads.
|
|
|
|
To continue with the next section:
ECG Experiments, click here |