|
Compound Action Potential |
Strength-Duration curve |
| |
The objective of this part of the lab is to study the
interdependence between stimulus strength and stimulus duration in activating the nerve,
and to construct a Strength-Duration Curve. |
|
|
|
|
|
|
|
We have seen how the shape, amplitude and
duration of the CAP change as the stimulus strength increases, because progressively
stronger stimulation activates more and more individual nerve fibres, whose individual
action potentials summate to yield a CAP. Thus when the stimulus is stronger, a
larger number of fibres reach threshold. |
|
|
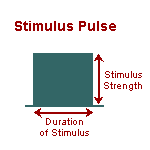
However, the threshold for activation of a fibre depends
not only on stimulus strength, but also on the
duration of the stimulus. |
|
Depolarization of an excitable membrane
requires flow of electrical charge across the membrane. Because of the
dominant electrical capacitance of the membrane, the relevant parameter
for effective membrane depolarization is the total amount of charge
transferred across the membrane. |
|
For a short duration stimulus generating a
steady trans-membrane current, the charge (Q) transferred is
proportional to the product of current I and time T: |
|
Q
= I x
T
|
|
Hence if the amount of charge required to
activate the fiber is Qt, and the stimulus duration is D, the current It
required to achieve activation will be: |
|
It =
Qt / D |
|
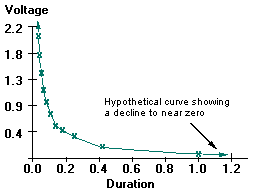
This suggests that a graph of threshold
stimulus strength versus stimulus duration should show a decline to near
zero as stimulus duration is increased. In other words, the stimulus
strength required to reach threshold should decrease during more
prolonged stimulation. Note that we can use voltage (V) and current (I)
interchangeably as the measure of stimulus strength. |
|
|
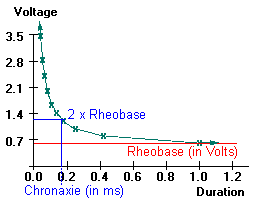
The Strength-Duration Curve for a typical
neural membrane is similar, but differs in that the curve clearly
flattens out with long stimulus durations, reaching an asymptote called
the RHEOBASE. When the stimulus strength is below the rheobase,
stimulation is ineffective even when stimulus duration is very long. |
|
|
The discrepancy between the observed shape of
the Strength-Duration curve and that predicted by the equation above, is due to the fact
that the predicted relationship is true for an
ideal
capacitor, with no
leakage resistance. During prolonged stimulation (large values of t), the equation
fails to predict the charge transfer across the nerve membrane because under these
conditions the actual charge transfer is less than predicted, owing to leakage due to the
appreciable electrical resistance of the membrane. Because of the interplay
between resistive and capacitive effects in the membrane, charge transfer (and membrane
potential) actually rises exponentially to a plateau during prolonged stimulation, instead
of increasing linearly with time. Thus if the stimulus is too small, the membrane
potential never reaches threshold. |
|
When examining the Strength-Duration
relationship in a nerve trunk, containing thousands of nerve fibres, one
must be careful to consider which of these many fibres the threshold in
question pertains to. The threshold stimulus voltage for the CAP as a
whole is actually the threshold for the fastest, most excitable fibres
in the nerve. As it is difficult to accurately determine this threshold,
the procedure outlined below uses as a reference signal a CAP whose peak
amplitude is about one fifth of Maximal. Thus this threshold is clearly
the threshold for another less excitable group of fibres. |
|
|
|
|
To begin, the stimulus duration is set to
1.0 ms using the knob on the stimulator. |
|
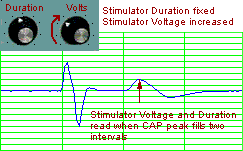
STEP A: The
stimulus voltage is increased slowly until a CAP appears. In
this example, we have adjusted the voltage
until the CAP amplitude fills two intervals of the horizontal grid on the screen. This CAP amplitude will
be used as a reference for the rest of the experiment. (Another
reference line can also be chosen, provided it is kept throughout the
exercise) |
|
|
We read the stimulus voltage from the stimulator, and the
corresponding stimulus duration (in this first case 1 ms) and enter this pair of values
into a table. Thus this stimulus duration and voltage have brought to threshold a small
group of excitable fibres in the nerve, although they are not the most excitable.
|
|
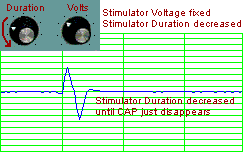
STEP B: Now we slowly decrease
stimulus duration until the CAP disappears. (We stop when the display shows a flat
line where the CAP used to be). |
|
|
Then we repeat STEP A; that is,
increase the stimulus voltage until the CAP reaches the reference amplitude noted above.
(In this case filling two intervals of the grid). We read the new stimulus voltage
and stimulus duration from the stimulator and enter the pair of values into the table. |
|
This procedure is repeated until we have 10
different pairs of values. Using our data, the strength-duration curve is plotted: |
Strength
(V) |
Duration
(ms) |
| 0.64 |
1.0 |
| 0.8 |
0.42 |
| 1.0 |
0.25 |
| 1.2 |
0.18 |
| 1.42 |
0.134 |
| 1.62 |
0.105 |
| 2.0 |
0.082 |
| 2.4 |
0.063 |
| 2.82 |
0.05 |
| 3.45 |
0.038 |
|

|
|
Besides the Rheobase, the Strength-Duration
Curve also provides another piece of information, the Chronaxie. The Chronaxie is a
duration measurement, corresponding to twice the Rheobase. From the graph above, the Rheobase is approximately 0.64 volts, and the
Chronaxie is about 0.16 ms. |
|
|
|
|
|
Q: What is the
significance of the Rheobase?
A: Usually around the 1 ms mark on the
strength-duration curve, the curve flattens out at the Rheobase, the point where
a progressive increase in pulse duration is no longer associated with a progressive
decrease in voltage. In other words, for longer stimulus durations, the minimal
voltage required to bring the nerve to threshold will be the Rheobase. |
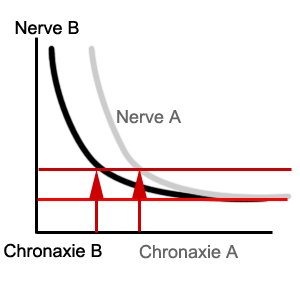
Q: What is the significance of
the Chronaxie?
A: Given that two nerves have the same
Rheobase, the Chronaxie (the stimulus duration corresponding to twice the rheobase) can
give an indication of their relative excitabilities. In the strength-duration curve
to the right, nerve B is the more excitable. |
 |
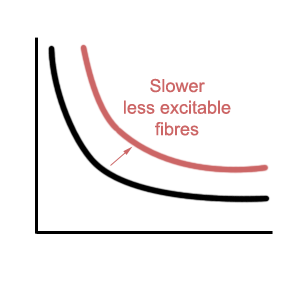
Q: How would the
strength-duration curve for a set of slow fibres (not very excitable) compare to the
strength-duration curve for a set of quick fibres (very excitable)?
A: The curve for the slower
fibres
would be shifted to the right, indicating that for a given stimulus strength, a longer
stimulus duration would be needed to bring the slower fibres to threshold. |
 |
|
Click here to continue with the topic of
Conduction velocity (difference and absolute methods) |
|
|
|